
A PLC splitter can arrive with a passing factory report and still appear to have excessive loss after installation. In other cases, one output port fails while the other ports remain normal. The difficult part is that both symptoms can be described as "high splitter loss," even though the underlying failure mechanisms are completely different.
A high reading may be created by an incorrect test reference, a contaminated connector, a stressed pigtail, a weak splice, package-induced alignment drift or a genuinely marginal PLC output port. Replacing the splitter before separating these mechanisms can waste time and leave the real fault in the network.
The right troubleshooting question is therefore not simply "Is the loss too high?" It is: where was the additional loss introduced, and what physical process created it?

The measured result includes more than the PLC chip. Package, pigtails, connectors, splices and the test reference can all affect the final value.
Start outside the splitter and work inward. First rebuild the optical reference and verify the instrument. Then inspect and clean every connector interface. Next isolate the splitter from field splices and stressed routing. Compare all output ports at the same wavelengths. Only when the abnormal loss follows one port or the splitter body under controlled conditions should the PLC assembly itself become the primary suspect.
Why Does PLC Splitter High Loss Create a Difficult Diagnostic Problem?
A splitter is tested as one component in the factory but measured as part of a larger optical path in the field. That difference creates several overlapping failure sources.
These challenges explain why troubleshooting should follow the failure chain rather than jumping directly from a high meter reading to "bad PLC splitter."
Why These Five Failure Mechanisms Stand Out
Reference and Instrument Error: When the Loss Is Not in the Splitter
The first failure mechanism is a measurement artifact. An optical power meter calculates insertion loss from the difference between a reference level and the power measured at an output port. If the source drifts, the reference cord changes, the meter is on the wrong wavelength or the zero reference is rebuilt incorrectly, the calculation can report excess loss even when the device has not changed.
Connector Interface Failure: Contamination, Air Gaps and Polish Mismatch
On a connectorized splitter, the PLC chip may represent only part of the measured loss. Dust, oil, end-face defects, incomplete mating or an SC/APC-to-SC/UPC mismatch can add attenuation and reflection at the interface. A contaminated connector can also transfer debris to the opposing ferrule, turning one dirty end face into two damaged interfaces.

Connector contamination can create high insertion loss even when the internal PLC circuit remains within specification.
Pigtail, Splice and Bend Failure: When Installation Adds the Loss
A bare fiber or blockless PLC splitter is normally integrated into a tray, cassette, FDB or closure. The installed path may therefore include fusion splices, protected pigtails and tight internal routing. A weak cleave, core offset, cracked splice protector, pinched pigtail or small-radius loop can add loss outside the PLC chip.

A compact splitter saves space, but its pigtails still require strain relief, bend control and protected routing inside the host enclosure.
Package and Assembly Drift: Stress Reaches the Chip-to-Fiber Interface
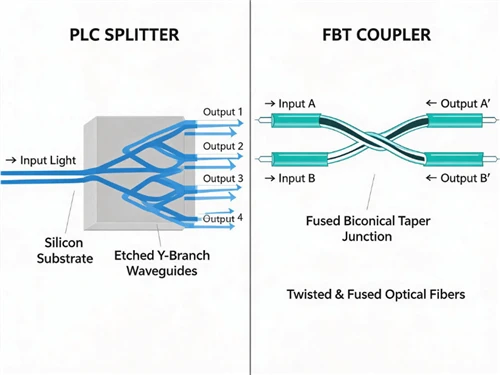
Inside a PLC splitter, the planar waveguide chip is aligned to input and output fiber arrays. The package, adhesive system and strain-relief structure are intended to keep that alignment stable. If assembly stress, impact, vibration or thermal expansion is transferred into the optical interface, coupling efficiency can fall and one or more ports can drift.

Package reliability depends on maintaining optical alignment while protecting the chip, fiber arrays, pigtails and internal bonds from stress.
Intrinsic Weak Port or Environmental Aging: When the Splitter Itself Is the Fault
After the measurement setup, connectors, splices and routing have been excluded, the remaining mechanism may be internal to the splitter. A marginal waveguide branch, fiber-array alignment issue or aging-related package drift can make one output port weaker than the others. This is why average insertion loss alone is not enough for incoming inspection.

A reference chart can flag an implausible result, but acceptance should follow the exact product specification and per-port test report.
Glory Optical's PLC splitter test-report guide recommends checking every output port, the worst-port value, uniformity, wavelength, connector configuration, batch number and pass/fail threshold. A passing average can still hide a port that places the most marginal subscriber path outside the planned budget.
How to Separate the Failure Mechanisms in the Field
The fastest workflow is not the one with the most instruments. It is the one that changes only one variable at a time.
| Observed Pattern | Most Likely Mechanism | Confirm With | Do Not Assume |
|---|---|---|---|
| All ports shift by nearly the same amount | Reference, light-source or common input-connector problem | Rebuilt reference and known-good input cord | That every PLC branch failed at once |
| Loss changes after remating or cleaning | Connector contamination, adapter or ferrule issue | End-face inspection and alternate mating hardware | That the PLC chip changed during cleaning |
| Loss changes when the tray, lid or pigtail moves | Bend, splice or strain-transfer problem | Open/closed enclosure comparison and dual-wavelength test | That the enclosure position is irrelevant |
| Loss changes with temperature or package handling | Package or internal alignment drift | Standalone repeat test without pigtail tension | That a stable room-temperature test proves environmental stability |
| One output remains high under every controlled test | Intrinsic weak port or internal assembly defect | Complete per-port data and uniformity calculation | That a passing average approves the unit |
Why Configuration Matters Before Calling the Loss "Too High"
The expected value depends on the split ratio and the tested configuration. A connectorized ABS box should not be judged against an unconnectorized bare-device number.
Example: 1×8 ABS Box PLC Splitter
The Glory Optical product page lists a 1260–1650 nm operating range. For the referenced 1×8 ABS configuration, it gives a typical/max insertion loss of 10.3/10.8 dB excluding connector loss and 10.8/11.3 dB including connector loss. This illustrates why the report must identify whether the measured unit is connectorized and what test plane was used.
The same page lists SC/UPC, SC/APC, LC/UPC, LC/APC and other connector options, so connector type and polish must be matched to the order before interpreting return loss or insertion loss.
View 1×8 ABS PLC splitter specifications →PLC Splitter High-Loss Diagnostic Workflow
| Step | Action | Failure Mechanism Excluded | Record to Keep |
|---|---|---|---|
| 1 | Verify meter calibration, source stability, wavelength and reference cords | Measurement artifact | Instrument IDs, wavelength and reference method |
| 2 | Inspect, clean and re-inspect every connector in the test path | Contamination and mating failure | Inspection result and connector configuration |
| 3 | Test the splitter outside the field splice and enclosure where possible | Splice, bend and routing loss | Standalone vs installed readings |
| 4 | Measure all output ports at the same required wavelengths | Hidden weak-port condition | Per-port insertion loss and uniformity |
| 5 | Compare results with the exact package and connector specification | Wrong acceptance baseline | Datasheet revision and agreed pass/fail limit |
| 6 | Repeat while removing pigtail tension and controlled package movement | Package or strain-related drift | Before/after and handling-condition results |
| 7 | Hold, replace or escalate the unit if the same port remains out of specification | Confirms likely internal failure | Serial number, batch number and failure trace |
How Product Design Helps Reduce High-Loss Risk
A PLC splitter cannot prevent dirty field connectors or an incorrect power-meter reference, but product design and factory controls can reduce the probability that mechanical and internal defects reach the network.
- Complete per-port testing: reveals the worst port instead of relying only on the average.
- Traceable test reports: connect the measured data to the package, connector type, batch and serial number.
- Appropriate package selection: protects bare or blockless assemblies from field handling when an ABS, cassette or LGX format is more suitable.
- Controlled strain relief: prevents pigtail loads from reaching the chip-to-fiber-array interface.
- Connector end-face control: reduces loss and reflection added after the PLC circuit.
- Reliability qualification: evaluates whether the product family remains stable under mechanical and environmental stress.
Glory Optical offers PLC splitter configurations from bare fiber and blockless modules to ABS box and cassette formats. The correct choice depends on whether the splitter is factory integrated, fusion-spliced in the field or installed as a connectorized replaceable module.
Conclusion
High PLC splitter loss is a symptom, not a diagnosis. The reading can be created by the test reference, the connector interface, the field splice, stressed routing, package drift or an intrinsic weak output port.
A reliable diagnosis starts by rebuilding the reference, cleaning and inspecting the interfaces, isolating the installed hardware, measuring every port and comparing the result with the exact tested configuration. Replace the splitter only when the abnormal loss remains with the device under controlled conditions.
Request PLC Splitter Data or QC Support